Implementation of workflows
TO BE UPDATED BY JUERGEN
In SimStadt, the framework to carry out simulations is the workflow. A workflow is a sequence of workflow steps, which can themselves be made of different steps and which often use the values computed in the previous steps. Each step takes elements (e.g. instances of SimStadtModel or SimStadtBuilding) as input, process them and returns elements as output (the same which have been modified or new ones), which are passed to the next step. For instance, a step can be responsible for loading the city model from an input gml file, or supplementing the input model with the missing building data needed in next steps, or computing energy data for the buildings contained in the input model. In the Simstadt GUI, the steps of the current workflow are displayed as buttons in the upper scrolling pane, as shown on the figure below.

The first step of the photovoltaic potential workflow is the ImportCityGml step, where the city model is loaded. Then, the Preprocessing step falls into two steps : BuildingFilter, where the buildings which don’t have a level of definition in the expected range are moved away and GeomPreprocessor, where geometric properties of the buildings are computed. In the WeatherPreprocessor step, weather data is imported from a database or a file. In RadiationProcessor, the irradiance on the surfaces of the buildings is computed, and in PVPotential, the potential nominal power and energy yield of suitable roof surfaces are calculated. Note the whole workflow, like every workflow as of release 0.3, is encapsulated in a workflow step called CityGmlToSimStadtModel.
The advantage of such a structure is that it is possible to create a new workflow by combining already-developed workflow steps and newly-written ones, which will use the output of the first ones. In this tutorial, we will first learn how to write properly a new workflow step, and then how to create the workflow by combining workflow steps.
NB : In this whole tutorial, italic words refer to java classes, mostly of the SimStadt project
Contents |
[edit] Writing a new workflow step
Each workflow step must extends the abstract class WorkflowStep of the package SimStadtRepository (eu/simstadt/admin). Some of them extends this class directly, like BuildingFilter, but most of them extend the class WorkflowStepWithGraphics of the package SimStadtFrontEnd (eu/simstadt/graphics), which is a subclass of WorkflowStep and implements the display of the step results as charts, maps or 3D view in the visualization pane (right part) of Simstadt GUI. For example, MonthlyEnergyBalance (last step of the Monthly Heat Demand Analysis workflow) and PVPotential (last step of the Photovoltaic Analysis workflow) are both subclasses of WorkflowStepWithGraphics. The subclass Workflow of the package SimStadtRepository (eu/simstadt/admin) also extends WorkflowStep and is the superclass for workflow steps, called sub-workflows, that are made of several other workflow steps. For example, Preprocessing extends Workflow. On top of that, there is an interface called WorkflowWithSpecialInterface in the package SimstadtFrontEnd (eu/simstadt/desktop) which can be implemented by any workflow step if it should have a customised parameters pane (left part of the GUI). PVPotential implements WorkflowWithSpecialInterface.

[edit] Simple workflow step
To create a simple workflow step without any results to display and which does not fall into other sub- workflow steps, there is only to create a new class which extends WorkflowStep.
As WorkflowStep is a parameterized class, the first thing to do is to provide the three parameters needed : in a WorkflowStep<X,Y,S>, X is the input element type of the workflow step, Y is the output element type and S is the type of elements processed in the super workflow step if the workflow step is part of a sub-workflow, Void otherwise. For instance, BuildingFilter is a WorkflowStep<Building, SimStadtBuilding,SimStadtModel> because it is part of the sub-workflow Preprocessing, whose input and output element types are both SimStadtModel.
Then, the constructor(s) can be written. There must always be an empty constructor, used in the xml encoding and decoding processes of storing the workflow step parameters. If not, SimStadt will crash while starting. Other constructors can be added following the attributes of the workflow step.
If some attributes have to be set from the GUI, but without requiring a special interface (in this case, see Workflow step with special interface below), then each of these attributes must have a setter and a getter with the correct name (the name of automatically generated getters and setters), so that the workflow step can be considered as a JavaBean. The name of these attributes must also be different from “description”, “progress”, “unitsProcessed”, “name” and “root”, otherwise they will be ignored (SimStadtGuiController line 576). Then, they are added to a PropertySheet (org.controlsfx.control.PropertySheet) which generate a column of editors in the left part of the GUI, allowing to edit these attributes. For example, the editor for a double or a String will be a text field, the editor for a Boolean will be a check-box and for an enum type, it will be a choice-box. New editors can be created in the class PropertyEditorFactoryWithList of the package SimStadtFrontEnd, (eu/simstadt/workflow), if the default editor does not suit or exist. Then the method call must be completed as explained in the comments of this class. There are already default editors for the String, Number, Boolean, LocalDate, Color, Paint, Font and enum types (see org.controlsfx.property.editor.DefaultPropertyEditorFactory, superclass of PropertyEditorfactoryWithList). Moreover, to avoid any NullPointerException, the attributes which can be edited in the GUI must be initialized in the new workflow step class.
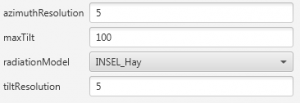
Property sheet of the radiation processor
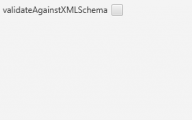
Property sheet of the ImportCityGml step


At last, some methods have to be overridden. The core method of a workflow step is the stream method, whose argument is a Stream<X> (X input type of the step) and which returns a Stream<Y> (Y output type). In this method, it is possible to act on the elements of the stream with the peek, map, flatMap and filter methods of the class Stream. For the sake of clarity, it is better not to write too much code in this method, but to call other methods defined further in the class. Here is an example for the stream method :
@Override
protected Stream<Y> stream(Stream<X> inputs) throws Exception {
	return inputs
		.filter(this::filter)
		.map(this::mapFunction)
		.peek(this::peekFunction)
	}

private boolean filter(X x){...}

private Y mapFunction(X x){...}

private void peekFunction(Y y){...}
NB : this::mapFunction is the same as x -> this.mapFunction(x)
The two other methods to override are displayResults and resetResults, but as they are only useful for workflow steps with graphics or with a special interface, so in the current case only an empty implementation must be provided.
Workflow steps extending WorkflowStep :
- eu/simstadt/workflow/BuildingFilter (package SimStadtFrontEnd)
- de/hftstuttgart/simstadtworkflows/energy/DistrictHeatingGenerator(package SimStadtWorkflowsEnergy)
[edit] Workflow step with graphics
Most of workflow steps allow to display the results they compute, in charts, maps or 3D view. To do so, they extend the abstract class WorkflowStepWithGraphics, which is a subclass of WorkflowStep and provides all the displaying tools.
To write a new workflow step with graphic, first follow the instructions to create a simple workflow step. The parameters of WorkflowStepWithGraphics are the same as WorkflowStep, there is also the possibility to generate a property sheet, and the stream method must be overridden.
Then, the maps and charts needed should be declared. Concerning the charts, it is possible to choose among one of the existing subclasses of the class Graphic of the package SimStadtFrontEnd (eu/simstadt/graphics/charts) or to create a new subclass (see Appendix). Concerning the maps, they should extend the class Maps of the package SimStadtFrontEnd (eu/simstadt/graphics/maps). There are already two subclasses of Maps : MapsSimStadtBuilding, for steps whose results depend on buildings (f.i. the energy demand) and MapsBoundarySurfaceUnit when the results depend on boundary surfaces (f.i. the irradiance).
After that, the method initialize has to be overridden. The first thing to do is to call the superclass initialize method (super.initialize()). Then, all the maps and charts can be instantiated and their parameters set : name, value function, initial value, etc (see Appendix). At last, the maps should be added to the map controller, which manages the maps tab, and the charts to the chart controller, which manages the charts tab :
graphics.getMapController().addGraphic(...);

graphics.getGraphicController().addGraphic(...);
The next step is to override the method display. It is called at the end of the workflow step once all the calculation is over. Its main goal is to send to the charts and to the maps for each building the new values computed. If the Y parameter of the WorkflowStepWithGraphics is a SimStadtModel, the best solution is to loop over all its SimStadtBuilding (SimStadtModel.getSimStadtBuildings()) ; if it is a SimStadtBuilding, the following instructions should directly be executed. Each SimStadtBuilding has to be added to the maps :
graphics.getMapController().addBuilding(building);
Then, the values computed for the building should be added to the corresponding chart with the add method of WorkflowStepWithGraphics. For example, with imaginary functions :
area = building.getPhysicsProperties().getHeatedArea();
add(co2Chart, building.getCo2Emissions(), area);
add(energyChart, building.getEnergy(), area);
The first argument of the add method is the Graphic to which the second argument, i.e. the computed value, must be added. The third argument is the area of the building (except for GraphicCategoriesOtherVariables, see Appendix), used in the area mode of the charts, in which the surface corresponding to a chart category is proportional to the total surface of the buildings of this category and not the number of buildings in this category.
The resetResults() method is already overridden in the WorkflowStepWithGraphic class.
Last step is to set the variables we want to be able to export in CSV with the export menu in the upper right of the visualization panel. These variables can either depend on the boundary surfaces or on the buildings. In some workflow steps, only one these two kinds of export is needed, then one the following lines should be added to the initialize() method to disable the corresponding export option:
graphics.getVizualizationPanelController().preventSurfaceExport();
graphics.getVizualizationPanelController().preventBuildingExport();
The methods buildingResults() or/and surfaceResults() must then be overridden to specify which data to export. The scheme for such methods is as follow :
@Override
public List<CSVData<SimStadtBuilding>> buildingResults() {
List<CSVData<SimStadtBuilding>> result = new ArrayList<>();
result.add(new CSVData<SimStadtBuilding>("Name of the variable [Unit]", bdg -> bdg.getVariable());
result.add(...);
return result;
}

@Override
public List<CSVData<BoundarySurfaceUnit>> surfaceResults() {
List<CSVData<BoundarySurfaceUnit>> result = new ArrayList<>();
result.add(new CSVData<BoundarySurfaceUnit>("Name of the variable [Unit]", bsu -> bsu.getVariable());
result.add(...);
return result;
}
Each CSVData added to result correspond to a column of the CSV files which will be exported. The first argument of the constructor CSVData is the header of the column, the second argument is the function to calculate the values of the column from a SimStadtBuilding or a BoundarySurfaceUnit. Note that a column with the IDs of the SimStadtBuilding (and with IDs of the BoundarySurfaceUnit in the case of a boundary surface export) will be added in the exported CSV files. The lines of the exported CSV file correspond tho the buildings/surfaces.
Workflow steps extending WorkflowStepWithGraphics :
In the package SimStadtWorkflowsEnergy (de/hftstuttgart/simstadtworkflows/energy) :
- CarbonPrimaryEnergyAnalysis
- MonthlyEnergyBalance
- PVPotential
- RadiationProcessor
- ShadowProcessing
- SolarThermalPotential
- ViewerWorkflow
- Visualization
- WeatherProcessor
In the package SimStadtFrontEnd (eu/simstadt/workflow) :
- GeomPreprocessor
- ImportCityGml
- VariantStrategy
- PhysicsPreprocessor
- UsagePreprocessor
- SystemsPreprocessor
[edit] Workflow step with special interface
Sometimes, the parameters of a workflow step are more complex than a simple sequence of parameters, and the PropertySheet is not suitable. In such a case, the workflow should have its own controller for the left part of the GUI (parameters pane) and implement the interface WorkflowWithSpecialInterface of the package SimStadtFrontEnd (eu/simstadt/desktop).
The first step is thus to create the special interface, for example with a fxml file (edited with Scene Builder) and its controller class (implementing Initializable) which will manage all the interface of the parameters panel, linking all the used fields, check- or choice-boxes, tables, etc… to the parameters of the workflow step. This controller can be initialized in the initialize method of WorkflowStepWithGraphics for example. Then a Node (or subclass) should be instantiated as the output of this controller. The method getSpecialInterface of the interface WorkflowWithSpecialInterface can then be overridden : it should return the special interface, for example the output of the controller.
The other method to override is hidePropertySheet, but it is quite simple : it returns true for almost all the workflow steps (unless we are trying to create some hybrid workflow step with two possible interfaces for the parameters panel).
Workflow steps implementing WorkflowStepWithSpecialInterface :
- In the package SimStadtWorkflowsEnergy (de/hftstuttgart/simstadtworkflows/energy) :
- PVPotential
- SolarThermalPotential
- In the package SimStadtFrontEnd (eu/simstadt/workflow) :
- VariantStrategy
- PhysicsPreprocessor
- SystemsPreprocessor
- CityGmlToSimStadtModel
Note that in the case of PVPotential and SolarThermalPotential, modifying the parameters has an impact on the maps and the charts.
[edit] Workflow
A workflow step can also be a sequence of sub- workflow steps (that is, a workflow), like the Preprocessing workflow step or the CityGmlToSimStadtModel workflow step which encapsulates all the workflows. It allows to create adjustable workflow steps : for example, depending on the workflows, Preprocessing does not always contain the same sub-steps. Such a super- workflow step must implement the Workflow class of the SimStadtRepository package (eu/simstadt/admin), which is a subclass of WorkflowStep.
The Workflow class has two more parameters than WorkflowStep : the input and output types of the sub-workflow. For example, Preprocessing takes a SimStadtModel as input, and returns a SimStadtModel too. However, the workflow it contains takes instances of Building as input, and returns instances of SimStadtBuilding as output (actually the instances of SimStadtBuilding which form the SimStadtModel output of Preprocessing ).
Then, at least one empty constructor must be provided. The stream method is overridden in the Workflow class, but there are now three other methods to override :
-
estimatedUnitsCount: an estimation of the number of units processed in the sub-workflow. If it cannot be estimated, it should return a negative integer. -
subworkflowInputStream: it returns the input stream of the sub-workflow, which can come from the input of the super- workflow step. Note that the method: current(): of the workflow class returns the current input of this super- workflow step. -
processSubworkflow: given the input of the workflow step and the output stream of its sub-workflow, it returns the output of this workflow step.
The methods displayResults() and resetResults() can also be overridden, but most of the time they are let empty, since there is nothing to display or reset.
Workflow steps extending Workflow :
- In the package SimStadtFrontEnd (eu/simstadt/workflow) :
- Preprocessing
- CityGmlToSimStadtModel
Once the new workflow steps have been created, they need to be put together and with other ones already existing.
[edit] Assembling workflow steps
To create the new workflow corresponding to (a) new workflow step(s), a new class implementing the interface WorkflowProvider (package SimStadtRepository, eu/simstadt/admin/spi) must be created, usually with a name close to and in the same directory as the last step of the new workflow.
The WorkflowProvider class has two parameters : the first is almost always a File, if the workflow loads the city model from a file, the second one is the output type of the last workflow step of this workflow (most of the time, a SimStadtModel).
Then, the interface methods must be overridden :
workflowName()must return the name of the workflow-
workflowDescription(()) must return its description -
workflowVendor()()must return the institution where the workflow was developed -
isExperimental()()must return true if the workflow is still being developed and tested, false otherwise -
createWorkflow()is the method where the workflow steps are put together. Its only argument is a string, which is the name given by the user when he creates a new workflow. It returns a TopLevelWorkFlow, most of the time a CityGmlToSimStadtModel, which encapsulates the steps of the workflow. The structure of this method should be as follow :
@Override
public CityGmlToSimStadtModel createWorkflow(String initialName) {
    return new CityGmlToSimStadtModel(initialName, WorkflowBuilder
		.start(new ImportCityGml("No validation"))
                .next(new Preprocessing("Preprocessing",
    WorkflowBuilder.start(new BuildingFilter("Filter"))
			.next(new GeomPreprocessor("Geometry"))
			.next(new PhysicsPreprocessor("Building Physics"))
			.next(new UsagePreprocessor("Building Usage"))
			.next(new SystemsPreprocessor("Energy Systems"))
		))
		next(new WeatherProcessor("WeatherProcessor"))
		.next(new RadiationProcessor("RadiationProcessor"))
		.next(new MonthlyEnergyBalance("Monthly Heat Demand Analysis"))
		.next(new CarbonPrimaryEnergyAnalysis("Carbon and Primary Energy")));
}
The WorkflowBuilder class is used to put together the steps, with its two methods start and next. The start method takes a WorkflowStep as argument, set its start step attribute to true and returns a WorkflowBuilder whose last step is its WorkflowStep argument. The method next takes a WorkflowStep as argument, sets its predecessor step and returns a new WorkflowBuilder with this argument as last step. Thus, each step knows which one is its predecessor. For a workflow step containing a subworkflow (Preprocessing for instance), there is only to provide a WorkflowBuilder as second argument of the workflow step constructor, built with the start and next methods, and the sub-steps.
If you are working in a new java project, you need to import the projects containing the steps you want to reuse in your project (for example SimStadtFrontEnd or SimStadtWorkflowEnergy). To do so, right-click on your project, choose Build Path>Configure Build path... and add the projects in the tab "Projects". Also, don't forget to add your project to the Run Configuration of Eclipse (click on the run menu button and choose the Run Configurations... item. In the tab Classpath, click on the User Entries item, then click on the "Advanced button" and choose "Folder". You can now add the bin folder of your project).
The last thing to do is to add a folder named "META-INF" in your project, in the folder "src". In this "META-INF" folder, create another folder named "services", and in this one a file named "eu.simstadt.admin.spi.WorkflowProvider". In this file you can add on a new line the full name of the Workflow provider you created, for example de.hftstuttgart.simstadtworkflows.energy.MonthlyEnergyBalanceWorkflowProvider. This way, the new workflow will appear in the workflow creation menu of the GUI, and can then be run as the others.
[edit] Appendix
[edit] Overview of the chart classes of Simstadt
The superclass for all SimStadt charts is Graphic<T>, where T is the type of the parameter according to which the buildings/surfaces of the buildings are going to be allocated in the graph. For example, for a graph showing the number of buildings with respect to the building heating system, T can be String, if the heating system is stored as a String in the building class. For a histogram giving the number of buildings with respect to the range of heat demand they belong to, T can be Double, if the heat demand is stored as a Double. If new kinds of charts are to be created, they must extend the Graphic class, so as to be integrated in SimStadt charts API.


[edit] GraphicRadar
This chart is used in the GeomPreprocessor workflow step to display the distribution of the buildings walls orientation. Each angular sector is proportional to the total surface of building walls being oriented in the corresponding direction. The parameter T is Double, it corresponds to the angle between the wall’s perpendicular and the north.
[edit] GraphicXYChart
This is the superclass for charts having two perpendicular axes.
[edit] GraphicAreaRelative
This is a subclass of GraphicXYChart, and a superclass for charts allowing to switch between the number of buildings in a category and their total area, and between absolute and relative (i.e. the percentage of the total) number/area of buildings in a category.
[edit] GraphicCategories
This is a subclass of GraphicAreaRelative sorting the buildings into (a finite number of) different categories related to strings. Examples :
- The building type chart of the workflow step PhysicsPreprocessor shows how many buildings there is belonging to each building type, the building type being a string attribute
- The suitability graph of the workflow step PVPotential shows how many buildings which are suitable for photovoltaic production there is in each usage category of building, the usage category being a string attribute
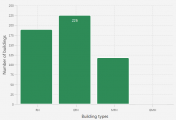
Building type chart of the PhysicsPreprocessor step
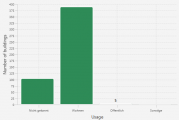
Suitability chart of the PVPotential step


The arguments of the GraphicCategories constructor are its title and the x-axis label, corresponding to the type of categories (f.i. “Building types”).
To add a building to a GraphicCategories, the arguments of the add method of the class WorkflowStepWithGraphics should be the GraphicCategories, the String representing the category and the area of the building (heating area).
GraphicCategoriesOtherVariables
In this subclass of GraphicCategories, the bars of the chart don't represent a number/area/percentage of buildings, but another (double) variable. For example, in the nominal power and yield charts of the workflow step PVPotential, the height of the bars is related to the sum of the nominal powers and yields of the buildings of the categories. The area/number switch function is disabled.
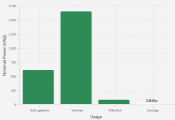
Nominal power chart of the PVPotential step
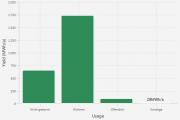
Yield chart of the PVPotential step


[edit] GraphicCategoriesUsage
This subclass of GraphicAreaRelative is almost like a GraphicCategories, but only for the usage chart of the workflow step UsagePreprocessor. There is an additional category, "Mixed Usage", representing the buildings who have a mixed usage and which is automatically added if at least one building has a mixed usage.
[edit] GraphicHistogram
This subclass of GraphicAreaRelative divides the buildings into several ranges according to some double attribute. For example, the
specific heating demand chart of the workflow step MonthlyEnergyBalance divides the buildings sorts the buildings according to their specific heat demand.
The arguments of the GraphicHistogram constructor are its title, the x-axis label corresponding to the ranges variable, and the number of decimals displayed in the ranges.
To add a building to a GraphicHistogram, the arguments of the add method of the class WorkflowStepWithGraphics should be the GraphicHistogram, the double attribute and the area of the building (heated area).
[edit] GraphicStacked

This subclass of GraphicAreaRelative is only used in the workflow step ImportCityGml. It shows the distribution of levels of definition (LOD). For each LOD, several bars can be stacked. The bottom one indicates the number of building whose maximum geometry LOD is this LOD. The above bars indicate, for each higher LOD, how many buildings, whose maximum geometry LOD is this higher LOD, have the current LOD. Therefore, there can be up to four stacked bars in the column LOD1, three in the column LOD2, two in LOD3 and one in LOD4. Thus, the total height of a column indicates how many buildings have a geometry with the corresponding LOD. What is not possible to know in general, is how many buildings have only a LOD3 or a LOD4. Currently (22/07/2015), there are no gml files with buildings having several LODs, so this kind of chart is not really useful. What’s more the colors have been deactivated (see lines 104,106 and 115 of the GraphicAreaRelative class).

[edit] GraphicMonthly
This subclass of GraphicXYChart is used in the workflow step WeatherProcessor to plot temperatures or irradiance evolution in a line chart.
The arguments of the GraphicMonthly constructor are its title, the unit of the plotted variable, the x-axis label and the name of the plotted variable (for the y-axis label).
To set the curve of a GraphicMonthly, the add method of the class WorkflowStepWithGraphics can be called with two arguments : the GraphicMonthly and the array (double[]) of the values corresponding to the curve.
[edit] Setting the parameters of a map in the initialize() method of WorkflowStepWithGraphics
A map is made of three views : the building view, the raster view and the density view.
The first one shows all the buildings or surfaces, with a color depending of the value returned by the value function of the map for this building or surface.
The raster view splits the map in small squares of the same side, and allocates one color per square, corresponding to the sum of the values of the buildings or surfaces having their center in the square divided by the square area.
For each building/surface, the density view allocates to the neighbouring pixels a density value (value of the building/surface divided by an area) decreasing with the distance to the building/surface center. As the color of a pixel depends on its value, this creates kinds of discs, which are then “added” (the values of the pixels are added). There are also isocurves in this view.
A view can be disabled by calling the method disable() of the class View.
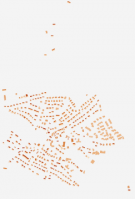
Building view
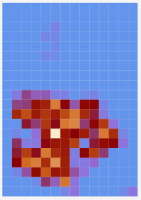
Raster view|
Density view

Scale


In the initialize() method of a WorkflowStepWithGraphics, a few methods need to be called on the maps in order to set their parameters.
First, the title of the map can be set while instantiating the Maps.
Then, the three views (building, raster and density) must be initialized by calling the method initValues for the building and raster views and the method initDensity for the density view. The initValues method take as arguments the view to initialize, the ceil and the threshold of the color scale, and the name and unit of the plotted variable. The arguments of initDensity are the variable name and unit, the smallest value of isocurve and other values for other isocurves.
The next step is to set the value function of the map, i.e. the function which takes a building or a boundary surface (depending on the type of map) and returns the value plotted on the map. The scaling should also be set for the three views. This is a coefficient by which the value function is multiplied when calculating the plotted value of a building, and which can be different for each view and depend on the building. It allows to chose the units of the different views. Here is an example : In the heating map of the workflow step MonthlyEnergyBalance, the value function returns, for each building, its energy demand in kWh/yr, but we want to plot, in the three views, the energy demand per area. For the raster and density views, without adding a scaling function, it will all the same be an energy demand per area since the value of a building is divided by an area in the view computation. But for the building view, without scaling function, the plotted value will be the energy demand. That’s why the scaling function is set to return the inverse of the building area, then the plotted value will be an energy demand per unit area, in kWh/m²/yr. What’s more, we want the unit of the raster and density views to be MWh/ha/yr. To convert from kWh/m²/yr to MWh/ha/yr, there is only to multiply by 10. That’s why the scaling function of the raster and density views is set to return 10.
After that, it I possible to choose a color gradient for each view, with the method setGradient. The argument must be a ColorGradient, enum type whose elements can be visualized on the right of the maps tab of the GUI, in the layers panel, in the choice box indicated by “color scheme”.
Example : the heating map in the workflow step MonthlyEnergyDemand
heatingMap = new MapsSimStadtBuilding("Heating demand");
heatingMap.initValues(heatingMap.getRaster(), 0, 1000, "Heating density", "MWh/ha.yr");
heatingMap.initValues(heatingMap.getBuildingView(), 0, 300, "Heating demand", "kWh/m�.yr");
heatingMap.initDensity("Heating density", "MWh/ha.yr", 1, 100, 200, 400, 1000);
heatingMap.setValueFunction(bdg -> (double) bdg.getEndUseMap().get(EndUseType.SPACE_HEATING).getEnergyDemand());
heatingMap.getBuildingView().setScaling(bdg -> 1.0 / bdg.getPhysicsProperties().getHeatedArea());
heatingMap.getRaster().setScaling(bdg -> 10.0);
heatingMap.getDensity().setScaling(b -> 10.0);
heatingMap.views(v -> v.setGradient(ColorGradient.AUTUMN));
heatingMap.getBuildingView().setGradient(ColorGradient.ENERGIEAUSWEIS);