Import City GML
- Purpose / Function
- Import a City GML model (possibly with EnergyADE data) using routines from CityDoctor. Note: We assume that the file has been checked and repaired by CityDoctor. Also note: Any LoD 0 geometries that might be present are ignored.
- Workflow Step Implemention
-
eu.simstadt.workflow.ImportCityGML extends WorkflowStart<SimStadtModel, Void>
- Special Parameters
- cityGmlFileName (String): Filename - with extension - of City GML file to be imported. The file will be looked up automatically in the directories of all preceeding workflow steps or project folders.
- validateAgainstXMLSchema (boolean): Wether to validate the import file against the XML Schema or not.
- Coordinate reference system
The coordinate reference system specified in the Citygml file (with the srsName attribute) must have one of those formats :
- "EPSG:X"
where X is a natural number corresponding to the EPSG id. Example : "EPSG:31467" for Gauss-Krueger-3 (see http://spatialreference.org/ref/epsg/31467/) or "EPSG:4326" for WGS 84 (see http://spatialreference.org/ref/epsg/wgs-84/)
- "urn:ogc:def:crs,crs:EPSG:X:YZ"
where X is a version number (ignored by Simstadt), Y is a natural number corresponding to the EPSG id, and Z is a string describing the elevation system (ignored by Simstadt). Example : "urn:ogc:def:crs,crs:EPSG:6.12:31467,crs:EPSG:6.12:5783" for EPSG:31467, i.e. Gauss-Kruger-3
- "urn:adv:crs:DE_DHDN_3GKX*Y"
where X is a digit between 2 and 5, corresponding to the Gauss Krueger Zone. Example : "urn:adv:crs:DE_DHDN_3GK2*DE_DHHN92_NH" for Gauss-Krueger-2.
- For any other string :
please find the corresponding EPSG id and please rewrite the srsName as "EPSG:X"
- Results Display
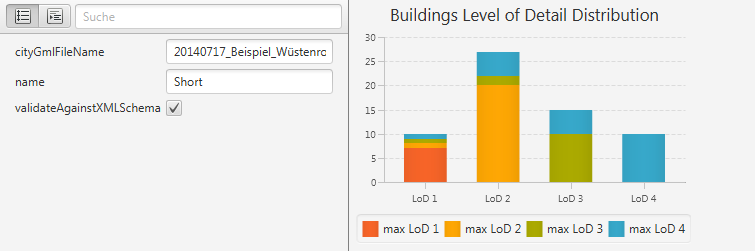
- We show the distribution of LoDs as found in the imported buildings. Any building can have several geometries with different LoD. The user is mainly interested in (A) the distribution of the maximal LoDs available and in (B) the distribution of the number of buildings for that a given LoD is present. These two are different, since each building is represented only once in (A) but more than once in (B) given it comes with more than one LoD. As shown below the two distributions can be depicted clearly in one bar chart with four stacked bars. The bars heights represent distribution (B), in which the bar for LoD 1 is added up from 4 colored segments representing the number of buildings with a maximum LoD of 1 at the bottom, topped by those with maximum LoD of 2, and so on. The bar for LoD 2, in general, has three segments, the bar for LoD 3 has two, and the bar for LoD 4, at last, contains exactly one segment representing the buildings with maximum LoD 4. The bar segments at the bottom represent distribution (A).
- Screenshot
-