Chart Step
Contents |
[edit] Description of the Chart Step Module
The ChartStep-Module retrieves building-data and builds charts from the extracted data (which is specified by the developer). To simplify the process, it is strongly advised to use the ChartStepBuilder-Class, which is used to configure default options for the Charts as well as to configure individual Charts and specify which data should be used (this is done via the ChartConfigBuilder-Class). Both classes, the ChartStepBuilder as well as the ChartConfigBuilder can throw exceptions, as they check for implausible configurations, and throw errors in those cases.
[edit] How to use the ChartStep Module via the ChartStepBuilder
- Create a new ChartStep Object in the Workflow, which shall implement the ChartStep-Module
- To start of, create a new Instance of the ChartStepBuilder-Class.
new ChartStepBuilder()
- There are several options which can now be choosen to set defaults for all Charts. These are:
enableAutoExport()
This enables the automatic export of all charts to a png file with the name of the chart inside the workflow directorysetDefaultChartStyle(ChartStyle defaultChartType)
This sets the default Style of all Charts, if none is given. Possible values are BAR, LINE, AREA, SCATTER, STACKED_BARsetDefaultChartLayout(ChartLayout layout)
This sets the default layout of the Chart, e.g. if the Chart is display horizontally or vertically. HORIZONTAL, VERTICALsetDefaultVisibleGridLines(GridLines visible)
This sets which grid-lines should be visible as default. Possible values are BOTH, HORIZONTAL, VERTICAL, NONE
- To add charts the following Method is called:
addChart(ChartConfig chartConfig)
To learn how to use ChartConfig to configure the individual settings for a Chart go here - Finally call the build()-Method to get a ChartStep-Object, which can be integrated into the Workflow. The build()-method throws a ConfigurationException if the configuration isn't correct. It detects if the given properties to ChartConfig (which will be explained in the next paragraph) do exist or if there are other errors in the setup.
[edit] ChartConfig and ChartConfigBuilder
- Create a new instance of a "ChartConfigBuilder"
public ChartConfigBuilder(String chartTitle)
The chart title will later be displayed in the drop down menu of the chart selection- The displayed property for the x- and/or y-Axis is set via
setXAxisProperty
andsetYAxisProperty
The property has to be the name of a get-Method that returns a displayable value and is directly accesible from the "SimStadtBuilding"-Class - To set a description for the Axis, the method
setXAxisDescription(String description)
andsetYAxisDescription(String description)
can be used - To additionally add an unit to the description the methods
setXAxisUnit(String unit)
and
setYAxisUnit(String unit)
can be used - To use another ChartStyle than the default, the method
setChartStyle(ChartStyle style)
can be used.
The same applies to the following two methods:setChartLayout(ChartLayout layout)
setVisibleGridLines(GridLines visibleLines)
- There are two ways (as of now) to draw a chart. Either by the frequency of the computed values or by treating all values as unique. Which one of those methods is used is set by the method
setChartMethod(ChartMethod method)
- To define an interval, in which the values should be grouped together, the method
setGroupingInterval(int grouping)
can be used. - As with the ChartStepBuilder the build()-method is called to build a ChartConfig object from the ChartConfigBuilder. The ChartConfig object can then be added to the ChartStepBuilder via the addChart(ChartConfig config) method.
Not all the settings have to be set, but for some a default value has to be set since it would not work without those.
If there are errors in the settings, build() will throw a ConfigurationException which will explain why the build failed.
The "ChartConfig" will later also contain the data which is extracted from the "SimStadtModel" which the "ChartStep"-Method obtains. It is possible to directly write values for the x- & y-Axis into the "ChartConfig"-Object, but it is discouraged.
The proper method to achieve the same goal would be to extend the "ChartStep"-Class and overwrite its "stream"-Method to change how data is extracted.
[edit] Example
In this example we will be using the ChartStepBuilder and the ChartConfigBuilder to build Charts.
[edit] ChartStepBuilder
First, we will be Creating a new ChartStepBuilder and setting default Options.
new ChartStepBuilder().setDefaultChartStyle(ChartStyle.BAR)
			.setDefaultChartLayout(ChartLayout.VERTICAL)
			.setDefaultVisibleGridLines(GridLines.BOTH)
			.enableAutoExport()
			.addChart([See ChartConfigBuilder Example])
			.build()
The first setting makes that all charts which do not specify anything else, will be Bar charts.
The second setting defines the default orientation of the charts, in this case vertical.
The third setting defines which grid lines should be displayed.
The last setting enables the automatic export of all charts.
With the exception of the last setting, all of those can be over-riden in the individual chart configurations.
The addChart method adds the individual charts, an example for this can be found in the following section.
With the build method, a ChartStep object is returned, which now can be added to a WorkflowBuilder.
[edit] ChartConfigBuilder
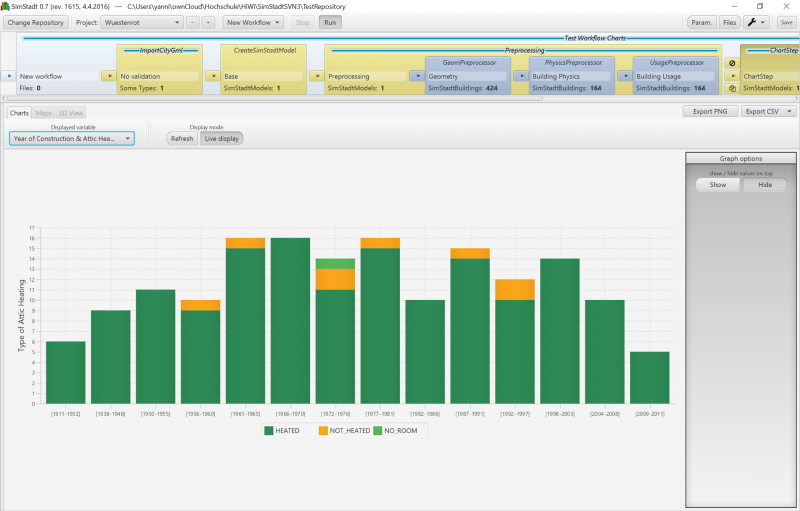
new ChartConfigBuilder("Year of Construction & Attic Heating with Categories")
					.setXAxisProperty("yearofconstruction")
					.setXAxisDescription("Year of Construction")
					.setYAxisProperty("atticheating")
					.setYAxisDescription("Type of Attic Heating")
					.setChartStyle(ChartStyle.STACKED_BAR)
					.setChartMethod(ChartMethod.FREQUENCY)
					.setGroupingInterval(5)
					.build()
Firstly a name for the Chart is defined. This should be as descriptive as possible, as it will be shown to the end user, and, if the chart is exported, used as file name.
The first method defines which property should be used for the x-Axis. In this case "yearofconstruction", which contains the year in which a building was built.
The second method adds a description to this axis, so that the end user knows what the values represent.
The next two options do the same as the two above, albeit with different values and for the y-Axis.
The ChartStyle method overrides the default setting, which we defined above, because this type of chart (stacked bar chart) is better suited for the data which we want to display.
Following sets the used Method to display the Chart, in this case Frequency.
Additionally we want to set an Interval, in which the data is grouped, which is achieved with the setGroupingInterval Method.
Lastly, we use the build method to create a ChartConfig object, which can now be added to the ChartStepBuilder via the addChart method.
[edit] Code Snippet
The following is an example of how the ChartStep Class can be used to build different charts, and how it is added to the WorkflowBuilder:
@Override
public CityGmlToSimStadtModel buildWorkflow() {
	ChartStep chartStep = null;
	try {
		ChartStep chartStep = (new ChartStepBuilder().setDefaultChartStyle(ChartStyle.BAR)
			.setDefaultChartLayout(ChartLayout.VERTICAL)
			.setDefaultVisibleGridLines(GridLines.BOTH)
			.addChart((new ChartConfigBuilder("Year of Construction & Attic Heating with Categories")
					.setXAxisProperty("yearofconstruction")
					.setXAxisDescription("Year of Construction")
					.setYAxisProperty("atticheating")
					.setYAxisDescription("Type of Attic Heating")
					.setChartStyle(ChartStyle.STACKED_BAR)
					.setChartMethod(ChartMethod.FREQUENCY)
					.setGroupingInterval(5)).build())
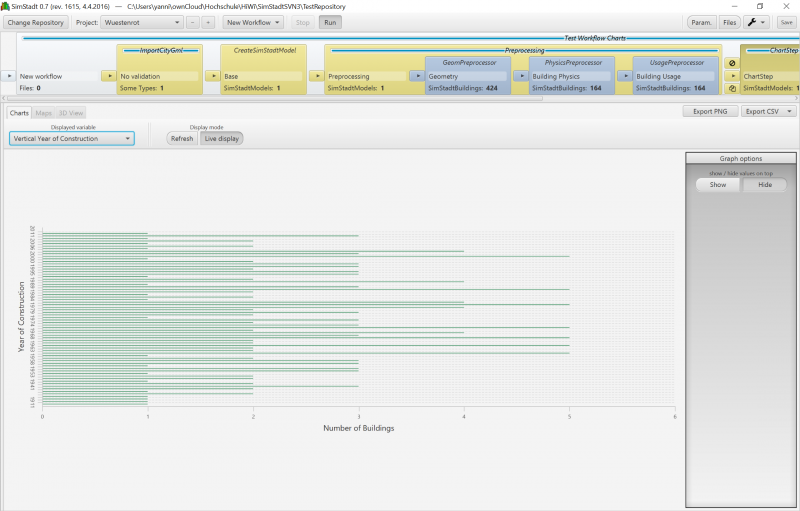
			.addChart((new ChartConfigBuilder("Vertical Year of Construction")
					.setXAxisProperty("yearofconstruction")
					.setChartStyle(ChartStyle.BAR)
					.setVisibleGridLines(GridLines.HORIZONTAL)
					.setYAxisDescription("Year of Construction")
					.setXAxisDescription("Number of Buildings")
					.setChartMethod(ChartMethod.FREQUENCY)
					.setChartLayout(ChartLayout.HORIZONTAL)).build())
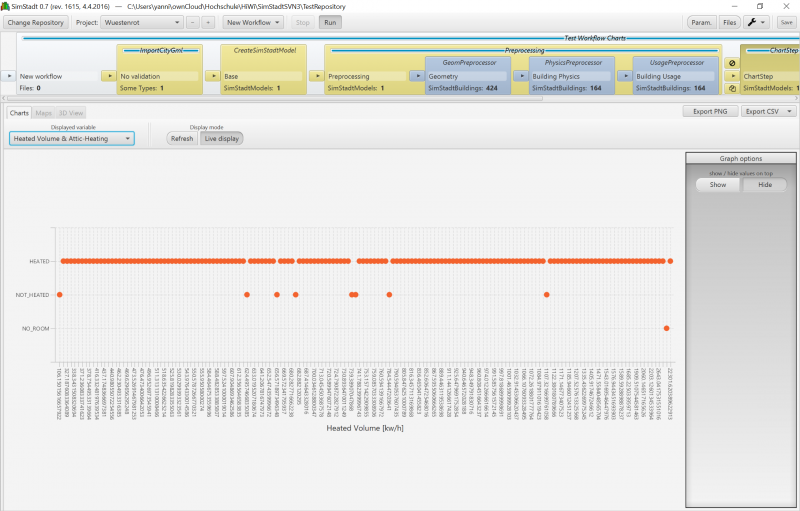
			.addChart((new ChartConfigBuilder("Heated Volume & Attic-Heating")
					.setXAxisProperty("heatedvolume")
					.setXAxisDescription("Heated Volume")
					.setXAxisUnit("kw/h")
					.setYAxisProperty("atticheating")
					.setChartMethod(ChartMethod.UNIQUE)
					.setChartStyle(ChartStyle.SCATTER)).build())
			.enableAutoExport()).build();
	} catch (ConfigurationException ex) {
		ex.printStackTrace();
	}

	return new CityGmlToSimStadtModel(WorkflowBuilder
			.start("No validation", new ImportCityGml())
			.next(new CreateSimStadtModel())
			.next("Preprocessing", new Preprocessing(WorkflowBuilder
					.start("Geometry", new GeomPreprocessor())
					.next("Building Physics", new PhysicsPreprocessor())
					.next("Building Usage", new UsagePreprocessor())))
			.next("ChartStep", chartStep)
			.next("WeatherProcessor", new WeatherProcessor())
			.next("RadiationProcessor", new RadiationProcessor())
			.next("Monthly Heat Demand Analysis", new MonthlyEnergyBalance()));
}
[edit] Screenshots of example
First Graph (Year of Construction & Attic Heating with Categories)
Second Graph (Vertical Year of Construction):
Third Graph (Heated Volume & Attic-Heating):


